Heather Mullins Crislip, President and CEO, Housing Opportunities Made Equal of Virginia
Brian Koziol, Research Director, Housing Opportunities Made Equal of Virginia
This post is adapted from Where You Live Makes All The Difference: Opportunity Mapping in the Richmond Region a report by Housing Opportunities Made Equal of Virginia (HOME), which can be found in full at http://phonehome.org/PolicyResearch/Research.aspx
Housing and education are inextricably linked. Quality schools have a strong influence on housing values. Therefore, higher performing school districts are often unaffordable for low-to-moderate income households.[i]
Moreover, access to a quality education is an essential ingredient to ensure future opportunity. Receiving a quality education increases the ability of an individual to secure adequate employment and stay financially stable enough to generate intergenerational wealth.
Educational Opportunities and Residential Location
As one study found, children from public housing living and attending schools in a middle class neighborhood, showed measurable improvement in academic performance over children with similar characteristics living and attending schools in a low-income neighborhood.[ii] Additionally, the Center for Housing Policy, the research arm of the National Housing Conference, contends that adequate and affordable housing significantly influences a student’s educational performance.[iii] If higher achievement in school has a positive impact on opportunity, securing affordable housing in high opportunity areas is imperative.
Access to quality schools typically equates to living in stable neighborhoods that benefit from higher-than-average median household income and have high levels of homeownership. Private education aside, the neighborhood in which a family resides largely determines the quality of education their children will receive. Additional educational opportunities such as Advanced Placement courses, after-school programs and a safe school environment depend on the tax base of the residential area. This is directly influenced by concentrations of wealth and poverty in the community.
HOME replicated a methodology on mapping opportunity developed by the Kirwan Institute for the Study of Race and Ethnicity at Ohio State University to map the educational opportunity of the Richmond Region. The following indicators were used to define educational opportunity:
- Percent Population 25 years and over with at least an Associate’s Degree This indicator demonstrates the level of education of those within each census tract. When students are surrounded by others with higher educational attainment, it is likely that they are able to get assistance in their studies. 2005 to 2009 American Community Survey 5 Year Estimates, U.S. Census Bureau
- Percent of students enrolled in AP courses The percentage of students enrolled in advanced programs is a key indicator of school quality at the secondary level. Students who take Advanced Placement courses can often count those credits toward college coursework. 2008-2009 Va. Dept of Education
- Percent Planning to attend Two-Year or Four-Year College This indicator represents the percent of students who plan to attend a two year or four year college after graduating from high school. 2006-2007 Va. Dept of Education
- English and Math performance score (percent passing) Schools, school divisions, and states are rated according to the progress toward the goals of the No Child Left Behind Act of 2001 (NCLB). This federal law requires states to set annual benchmarks for achievement in reading and mathematics leading to 100 percent proficiency by 2014. 2008-2009 Va. Dept of Education.
- NCLB Graduation Indicator No Child Left Behind (NCLB) requires schools to make progress in graduation for high schools. The graduation rate is based on the percentage of students achieving a regular high school diploma. 2007-2008 Va. Dept of Education
- Weapon incidents per 100 students Virginia’s accreditation standards require school report cards to include information about school safety. This indicator is used to demonstrate the number of weapon incidents per 100 students to indicate the level of student safety within each school. 2008-2009 Va. Dept of Education
- Dropout Rate Dropout percentages represent the number of dropouts for a given school year divided by the membership on September 30 of that school year. 2007-2008 Va. Dept of Education
These indicators were then weighted equally, and applied to the City of Richmond, Henrico, and Chesterfield Counties to map the levels of educational opportunity into categories of very low, low, moderate, high, and very high opportunity. The map below is the result:
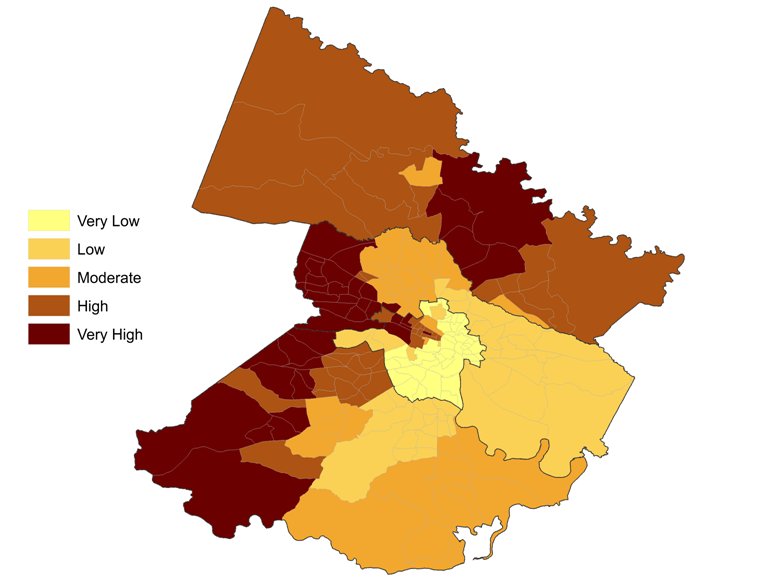
Educational Opportunity Map of the Richmond Region
The disparities in opportunity are evident when it comes to education in the Richmond area. All high opportunity areas are located in western portions of the city of Richmond, Chesterfield County, and Henrico County, and nearly all of Hanover County. The lowest opportunity areas are in the eastern, northeast, and southeast portions of the city of Richmond. Comparing two elementary schools in different opportunity areas of the region shows the direct impact that housing location has upon children’s educational experience. To zero in on how disparities in educational opportunity can manifest in a single municipality, we highlighted Chimborazo and Mary Munford elementary schools, both in the City of Richmond. The Mary Mumford district contains all very high or high opportunity census tracts while the Chimborazo district contains only very low opportunity tracts.
The Virginia Assessment Program Standards of Learning (SOL) test results reveal stark contrasts between the two schools. Third grade students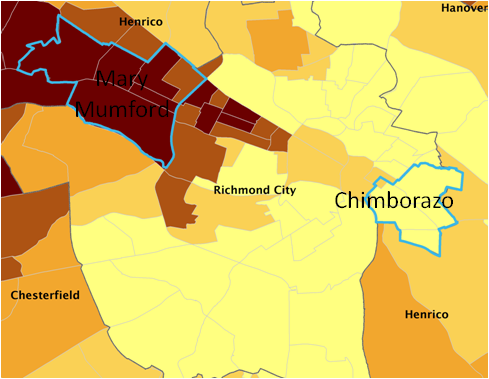 at Chimborazo Elementary are 2.25 times more likely to fail the reading assessment test, 18 times more likely to fail the math assessment test, 2.2 times more likely to fail the science assessment test, and 1.7 times more likely to fail the history assessment test than third grade students at Mary Mumford.
What is most startling, however, is the disparity between students who test at the advanced level of the reading assessment test. At Mary Mumford, 50 percent of third graders tested at the advanced level in the reading assessment compared to just 19 percent at Chimborazo.
Disparities were even higher among the other test categories: 61 percent of third graders at Mary Mumford tested at the advanced level in the math assessment compared to just 13 percent at Chimborazo; 54 percent in science compared to 14 percent; and 53 percent compared to 7 percent in the history assessment.
The fact that Mary Mumford has one of the highest percentages of out‐of‐district student attendance in the city further highlights the disparity in educational outcomes for families with the means to drive their children to a better school compared to those without that ability. It is clear that there exists great disparity in the educational outcomes of children based solely upon where they live. Simply put, this fact is neither just nor sustainable. Depriving children of an education based solely upon where they happen to live is short‐sighted public policy that can exclude children from society’s wealth cycle. Removing barriers to housing choice while simultaneously increasing the availability of affordable housing in high‐opportunity neighborhoods is the only strategy to ensure that all children of the region receive the type of quality education that will not only allow them to succeed in a dynamic economy, but arm the Richmond region with the skilled and educated workforce to compete economically in the years to come.
[i] McKoy, Deborah, and Jeffrey Vincent. “Housing and Education: The Inextricable Link.” In Segregration: The Rising Costs for America, by James Carr and Nandinee Kutty, 125 – 150. New York: Routledge, 2008.
[ii] Ibid.
[iii] Lubell, Jeffrey, and Maya Brennan. The Positive Impact of Affordable Housing on Education: A Research Summary. Research Summary, Washington, D.C.: Enterprise Community Partners & Center for Housing Policy, 2007.


